Earlier this week I wrote this article about how we can use graphs to help visualise ratings. I had a lot of emails about using visualisation in handicapping. I thought that I would write a part 2 and look a little bit more in detail at what we can do to help us visualise handicapping.
One way of using graphs is to plot all of a horses particular rating throughout its career and then compare this to other horses career ratings. The example below is of a race that I chose at random from the ones that are still to be run today. I am using a random power rating as the rating for our example.

This is for the horse Sunset Boulevard in the 2.00pm at Lingfield on Friday 8th January 2010. Does this help us? Not much. It does show us a possible pattern after getting a high rating he drops right back down to 0 before building up again.. I should let you know that Sunset Boulevard is the predicted Racing Post favourite in this race. To really make any sense of this we need to really plot this against finish positions.

This begins to make the picture a little bit clearer for Sunset Boulevard. Obviously the lower the blue line the better finish position he had. The gap in the blue line is where the horse was pulled up and so didn’t finish the race. We immediately see that when this horse has a rating higher than its last race rating then it doesn’t win. If we wanted to we could add some more lines but this would start to get complicated. What a lot of people do is to add the other horses in the race.

You begin to get a graph like above which is no more help than looking at numbers. What I am proposing is slightly different. That you use the graph to compare ratings directly with the other runners rather than with a horses past performance. In order to do this effectively then you need to be confident that your ratings are good assessors of the horses performance in this race.

This shows my LRP rating for the horses in the race. The horses that have 0 are not rateable. I find that this paints a very clear picture of the race. Kamanja, Nyetimber and Cactus King all had similar races last time out in terms of performance. Sunset Boulevard did not have such a good last race and the last two horses were not rateable. This doesn’t tell us much so we need to add another rating. I think speed will have a bearing in this race so I shall use my compiled speed prediction to see where then horses compare to each other.

The red shows the predicted speed. Now as you can see there is an immediate problem as the first rating is on a very different scale and so we cannot compare them easily. This is easily solved. The first rating worked on a 0 to 1 scale and the speed rating effectively works on -500 to 500. By multiplying our first rating by 100 we will be able to compare them more effectively.

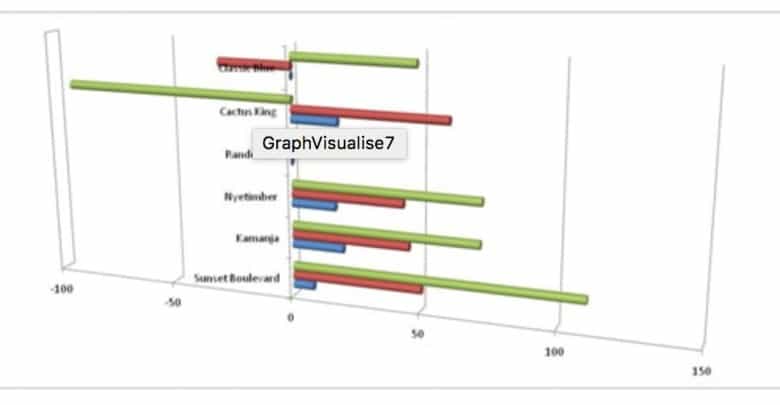
As the long as the ratio between the ratings stays the same. All we need is to be able to see the rating visually for each horse. I mentioned earlier that it is important that you understand your ratings to use this method. The speed rating (red) works slightly differently to the LRP rating. It can go negative and so a horse with 0 has not been un rateable but has got a rating of 0. The higher the rating the better the expected speed of the horse in the race. With just these two ratings we are beginning to get a good picture of the race. Classic Blue was not rateable in his last race and is expected to have a very poor speed. Randomer is a first time starter and so we cannot compare him. All the other horses are quite similar but Cactus King seems to have a slightly better performance last time out and a good expected speed. The favourite is not looking like anything special, odds dependant. I shall add one more rating which is a power rating.

I have been changing the graph types so that you can see different styles of graphs. Everyone will find a different graph easier to read and so this article will give you a few from the large selection available. The power rating is in green. As you can see this now changes our view of the race significantly. Cactus King has a very bad power rating, since we can see he has had a comparatively good last race and his expected speed is good then it could be due to form, class, collateral or a number of other factors we haven’t looked at. Randomer is a first time starter and only has a power rating based on connections. Classic Blue has nothing really going for him which leaves us with 3 contenders in Nyetimber, Kamanja and Sunset Boulevard.
Will this method find winners every single time? Of course not and what I have outlined in this article is just a template for you to begin working with and finding the method that suits you. Using graphs to visualise a race though can increase the speed and accuracy of your handicapping.
All the graphs in this article were created using Excel. You do not need to have Excel any spreadsheet package will do and OpenOffice is a free package that will allow you to create similar graphs. You just put your ratings for each horse in a spreadsheet, highlight them and create the graph. Changing the graph type is as simple as choosing your preferred graph from a list and it will change the style.
If you have any questions then please feel free to leave a comment or get in touch with me through the contact form.
Hi i know this was don some while ago but i`m new and have just come across
your graphs for the horse ratings now at one point you said its no more helpfull
than looking at numbers now i think you might have missed the point as you said it covered the horses previous proformances or speed ratings so what you would look at are those peaks and trough to see why they plumited as they did could it have been a change of going were they being asked to compete at a much higher levil and as you said sunset boulevard when it has a rating higher than its previous then it dosent win or proform well now the rating useualy correspond with the weight their set to carry so the graph may have shown that to be true of others it could also show when a horse is on an upgrade as well as a downn grade once it has reached its peak so it is possable that a reviset is needed just to see if they can tell you more than you once though the third graph down with the most lines is the best one for that exercise just look to see what was happening when it plumited was it any of the above mentioned (weight,going,class etc it may even have been that the horse dos not like a particular course )this will then tell you if everything today is in favour for any one of the horses i thought this might be usefull
There is a lot that you can see from a graph, especially if you find looking at something visually is better than looking at it numerically. I shall look at revisiting the visualisation technique in another article.