horse racing
-
Jan- 2010 -14 JanuaryAdvice

12 Easy All Weather Racing Statistics
Nine years ago I wrote a blog post looking at All Weather racing statistics. The summary was… 12 runners or less Horses that Lead the pace Who last raced between 22 and 56 days ago The results from this produced an average of +54 units profit per year at SP odds. Pretty good. The question now is, will these results…
Read More » -
8 JanuaryAdvice
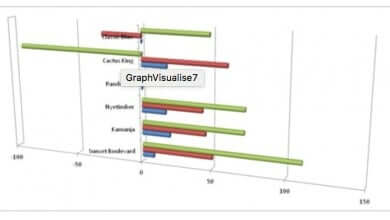
Using Graphs To Visualise Ratings – Part 2
Earlier this week I wrote this article about how we can use graphs to help visualise ratings. I had a lot of emails about using visualisation in handicapping. I thought that I would write a part 2 and look a little bit more in detail at what we can do to help us visualise handicapping. One way of using graphs…
Read More » -
2 JanuaryAdvice
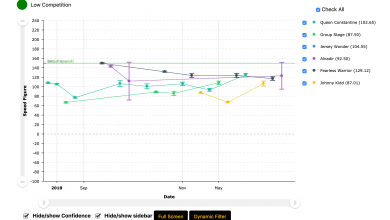
Simple Trick Turns Speed Ratings To Profits
I originally wrote this article about visualising horse racing speed ratings on the 2nd January 2010. It’s still one of the least used, most powerful methods for analysing a horse race. So I figured it was time to give it an update. Although admittedly there’s very little to update in terms of strategy! All the examples will be fresh and…
Read More »