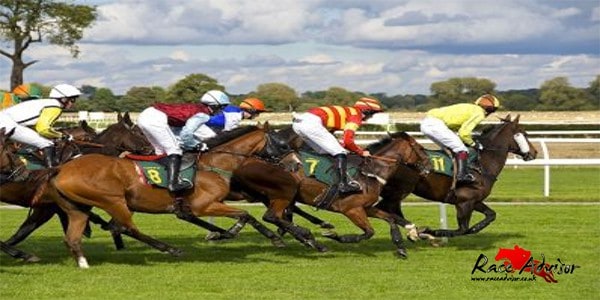
The ‘horses for courses’ cliché is used in an increasing number of instances in modern life. When it comes to betting, the saying refers to the notion that horses have preferences when it comes to specific racecourses. You can also use it to analyse the form of horses on courses similar to the one they are running on the day you decide to bet.
For some punters, the suitability of a track is one of the overwhelming factors that persuade them to place a bet or swerve the selection. In this article, I will discover if you should pay a significant amount of attention to the horses for courses mantra or if it a complete waste of time.
Track & Last Win
First I looked at the performances of horses on a certain track when their previous win had come at that specific track. I took data from 2012 onwards.
So for example, I looked at horses running at Ascot that also had their last win at Ascot. I did this for 5 different courses over Flat, AW and National Hunt.
| Track | Strike Rate | P/L | ROI |
| Ascot | 8.98% | -173.49 | -33.88% |
| Exeter | 13.65% | -72.73 | -29.21% |
| Nottingham | 16.54% | 44.52 | +17.53% |
| Uttoxeter | 14.68% | -101.7 | -23.33% |
| Wolverhampton | 13.01% | -1430.07 | -22.5% |
From this exploratory set of data we can see that horses that had their previous win at a track don’t often follow it up with another victory. Of course you have to factor in rises in class, season, age and a number of other things. Oddly enough, you would make a tidy profit at Nottingham despite the low strike rate which suggests plenty of winners at long odds.
Courses & Distance
It’s normal for the eyes of punters to light up when they see ‘C&D’ next to a horse on the race card. This is an indication that the horse has won over the same track and trip in the past. In theory, this would suggest the horse has an excellent chance but the reality is very different as you’ll see below.
Once again, I’ve included data from 5 tracks (2012-2016) but this time, we’re looking at the performance of C&D winners.
| Track | Strike Rate | P/L | ROI |
| Ayr | 12.54% | -193.91 | -20.43% |
| Chepstow | 14.45% | -93.63 | -15.03% |
| Newbury | 14.14% | -45.02 | -15.52% |
| Wolverhampton | 12.37% | -1401.61 | -21.73% |
| York | 8.55% | -125 | -21.82% |
Not good!
However, I wondered if handicap races could reduce the relevance of C&D winners so I looked at the above courses again only this time for non-handicap events.
| Track | Strike Rate | P/L | ROI |
| Ayr | 29.41% | -7.58 | -22.29% |
| Chepstow | 34.38% | -3.77 | -11.78% |
| Newbury | 24.66% | 4.05 | 5.55% |
| Wolverhampton | 20.13% | -26.16 | -4.15% |
| York | 10.88% | -16 | -10.88% |
While the strike rate increases and the picture looks rosier (you even make a profit at Newbury), it’s still not particularly good. Additionally, there aren’t that many races that fit the above criteria to begin with. For example, there are only 147 horses to choose from at York over the 5 year period.
What about Course Winners?
I’ll take a step back in terms of specificity and simply look at the performances of horses that had previously won on the track over any distance.
| Track | Strike Rate | P/L | ROI |
| Brighton | 13.29% | -279.02 | -26.88% |
| Cheltenham | 11.77% | -398.31 | -30.64% |
| Kempton | 11.66% | -1336.79 | -20.57% |
| Nottingham | 14.11% | 42.02 | 7.41% |
| Taunton | 17.9% | -40.86 | -11.61% |
For Kempton, I focused solely on Polytrack races. I also included Nottingham to see if the odd phenomenon of low strike rate/decent profit held firm and it did. Overall though, the outlook is pretty grim.
The Performance of Favourites
The final task was to take the same data but change it slightly to determine the performance of outright favourites (joint and co-favourites are not included) on a course where they had previously won.
| Track | Strike Rate | P/L | ROI |
| Brighton | 30.77% | -10.34 | -7.23% |
| Cheltenham | 41.25% | 15.55 | 9.72% |
| Kempton | 33.6% | -28.95 | -3.91% |
| Nottingham | 23.19% | -12.98 | -18.81% |
| Taunton | 40.63% | -3.86 | -6.03% |
There is an improvement in 4 of the 5 courses in terms of ROI. The exception is Nottingham which is to be expected since previous data showed it’s a course that likes longer odds winners. You would have made an ROI of almost 10% had you blindly backed favourites at Cheltenham that previously won on the course.
Conclusion
After a detailed look at the performances of:
- Horses that had their last win at the same course.
- Course & distance winners.
- Course & distance winners in non-handicap events.
- Course winners.
- Courses winners that were also favourites.
The conclusion is that you shouldn’t rely on a horse’s past performances on a course even if it is a C&D winner. There are other issues to take into consideration such as Class, Form, Weight, OR and many more. While it’s possible to make a profit when you perform forensic analysis, punters would appear to be better served by looking at other factors.